Probability distributions are useful to answer a myriad of questions. The python packages of numpy and scipy offer a number of probability distributions to answer questions on the likelihood of an event or describing all the likely values of a random variable.
A normal distribution also known as a Gaussian is a fairly common probability distribution that can help to answer many different types of questions. Let's work with a problem around
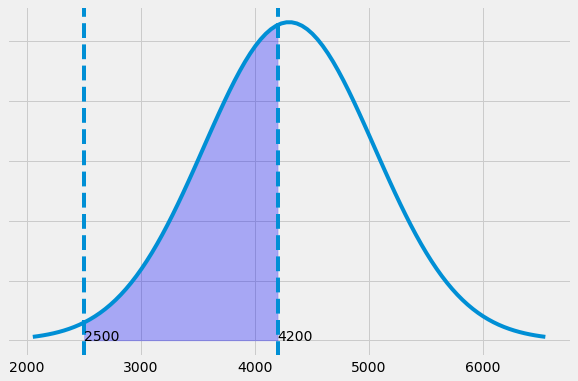
On average 4,300 acres burn per year in the state of Matto Grosso Brasil, with a standard deviation of 750 acres. The distribution of the number of acres burned follows a normal distribution. What is the probability that between 2,500 and 4,200 acres will be burned in any given year?
$$\mu = 4300$$
$$\sigma = 750$$
$$P(2500 < X < 4200) = P(-2.40 < Z < -0.13)$$
$$P(-2.40 < Z < -0.13) = P(Z < -0.13) - P(Z < -2.40)$$
$$P(-2.40 < Z < -0.13) = 0.4483 - 0.0082 = 0.4401$$
def probability(x1,x2,mu,sigma):
        prob1 = st.norm.cdf((x1-mu)/sigma)
    prob2 = st.norm.cdf((x2-mu)/sigma)
    x = np.linspace(mu - 3*sigma, mu + 3*sigma, 100)
    plt.style.use('fivethirtyeight')
    fig, ax = plt.subplots(figsize=(9,6))
    ax.set_yticklabels([])
    plt.axvline(x=x1,ls='--')
    plt.text(x1,0,'{0}'.format(x1),rotation=0)
    plt.axvline(x=x2,ls='--')
    plt.text(x2,0,'{0}'.format(x2),rotation=0)
    ax.fill_between(x_2,y,0, alpha=0.3, color='b')
    ax.plot(x, st.norm.pdf(x, mu, sigma))
    return prob2 - prob1
probability(2500,4200,4300,750)
$$P\approx .44$$
This probability distribution is used when the outcome of an experiment is a random variable,$$x$$ taking on a positive integer ($$x\in\mathbb{Z}$$).
Vehicles pass through a junction on a busy road at an average rate of 300 per hour.
References:
https://en.wikipedia.org/wiki/List_of_probability_distributions