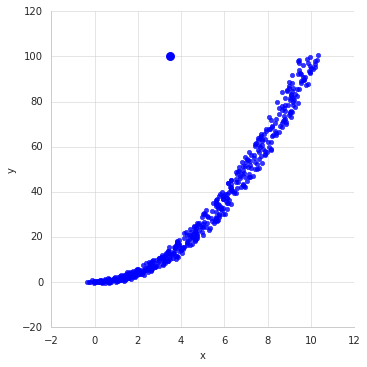
An outlier is a data point that is considered not representative from the rest of the data or if it causes problems in a standard statistical procedure. Outliers are actually fairly common within certain generating processes. Any observation featuring an abnormal distance from other values within the sample population is considered an outlier. A visual example of an outlier can be seen in the following plot. The datum at the coordinates (3.5,100) is clearly the outlier within this data set. Visual inspection is used often to see extreme values but as you increase dimensionality you will need much more clever ways to detect outliers.
Outliers tend to negatively impact your model's robustness. Now sometimes we may actually want to detect outliers like for example anomalous web traffic (hacking activity), fradulent credit card transactions, event detection, and many more use cases. Now, you may also want to maintain outliers because that is all the data you have and it is naturally occurring such as predicting 1000 year flood events. So, you need to ask yourself why certain data should stay within data.
Outlier detection is useful allowing a researcher to identify and then remove data that deviates so significantly from data generating process that it affects the robustness of a model.
Univariate
Multivariate
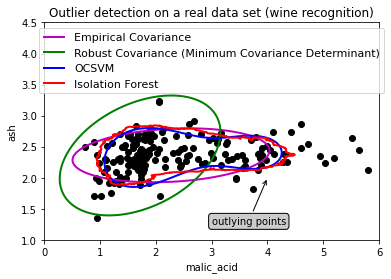
We will review scikit-learn library that offers built-in automatic methods for detecting outliers within our input data. We will use the wine data from preloaded datasets from scikit-learn looking at malaic acid
import numpy as np
from sklearn.covariance import EllipticEnvelope
from sklearn.svm import OneClassSVM
import matplotlib.pyplot as plt
import matplotlib.font_manager
from sklearn.ensemble import IsolationForest
from sklearn.datasets import load_wine

# Define "classifiers" to be used
classifiers = {
    "Empirical Covariance": EllipticEnvelope(support_fraction=1.,
                                             contamination=0.25),
    "Robust Covariance (Minimum Covariance Determinant)":
    EllipticEnvelope(contamination=0.25),
    "OCSVM": OneClassSVM(nu=0.25, gamma=0.35),
    "Isolation Forest":IsolationForest()}
colors = ['m', 'g', 'b','r']
legend1 = {}
legend2 = {}

# Get data
X1 = load_wine()['data'][:, [1, 2]]  # two clusters

# Learn a frontier for outlier detection with several classifiers
xx1, yy1 = np.meshgrid(np.linspace(0, 6, 500), np.linspace(1, 4.5, 500))
for i, (clf_name, clf) in enumerate(classifiers.items()):
    plt.figure(1)
    clf.fit(X1)
    Z1 = clf.decision_function(np.c_[xx1.ravel(), yy1.ravel()])
    Z1 = Z1.reshape(xx1.shape)
    legend1[clf_name] = plt.contour(
        xx1, yy1, Z1, levels=[0], linewidths=2, colors=colors[i])

legend1_values_list = list(legend1.values())
legend1_keys_list = list(legend1.keys())

# Plot the results (= shape of the data points cloud)
plt.figure(1)  # two clusters
plt.title("Outlier detection on a real data set (wine recognition)")
plt.scatter(X1[:, 0], X1[:, 1], color='black')
bbox_args = dict(boxstyle="round", fc="0.8")
arrow_args = dict(arrowstyle="->")
plt.annotate("outlying points", xy=(4, 2),
             xycoords="data", textcoords="data",
             xytext=(3, 1.25), bbox=bbox_args, arrowprops=arrow_args)
plt.xlim((xx1.min(), xx1.max()))
plt.ylim((yy1.min(), yy1.max()))
plt.legend((legend1_values_list[0].collections[0],
            legend1_values_list[1].collections[0],
            legend1_values_list[2].collections[0],
            legend1_values_list[3].collections[0]),
           (legend1_keys_list[0], legend1_keys_list[1], legend1_keys_list[2],legend1_keys_list[3]),
           loc="upper center",
           prop=matplotlib.font_manager.FontProperties(size=11))
plt.ylabel("ash")
plt.xlabel("malic_acid")

plt.show()
References:
https://www.kdnuggets.com/2017/01/3-methods-deal-outliers.html
https://scikit-learn.org/stable/modules/outlier_detection.html
https://archive.siam.org/meetings/sdm10/tutorial3.pdf
https://ieeexplore.ieee.org/abstract/document/4781136
https://towardsdatascience.com/a-brief-overview-of-outlier-detection-techniques-1e0b2c19e561